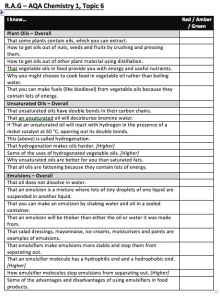
I have always found it useful to encourage students to rate their understanding of sub-topics at the end of a section. I find it helps students to identify areas they need to revisit in DIRT (dedicated improvement reflection time) and as the class teacher I can glance at these to get an idea of topics the whole class is struggling with. A great example of this type can be found on the TES website here.
Students indicate red for poor understanding, amber for intermediate, and green to show confidence in their understanding. To do this at a whole class level was demonstrated to me several years ago by a Head of Department at my former school. Here you record the red, amber and green (RAG) rating for the whole class on one tracking sheet. This gives you a great overall picture and if this is done throughout the course you can identify when the level of understanding is mastered so that it is safe to move on, or individuals struggling can be identified early on. If completed at the end of a course then it is very useful during the revision process. I have used assessment / diagnostic questions to make the RAG rating objective but my experience is that students are very good at both judging their understanding and at being honest enough to share that with the teacher (caution: this is not always the case, use judgement / knowledge of students). Since joining a Pixl school there are a wealth of tracking documents available for many subjects. The screenshot below shows an example from the Physics P1 course and topics that are not well understood and a student requiring intervention is identified:
![]() As you can see it’s not always as clean-cut as we would like but it certainly gives a starting point for revision. This was produced in Excel and was completed in class with students called up one at a time to RAG rate each sub-topic. What has really worked well with my current KS4 classes is to import this file into Google docs and share the link (editable link) with students who have then completed this as a homework. The spreadsheet looks a little different mostly because it is not possible to have vertical text as the column headings so this causes the spreadsheet to go off the page:
As you can see it’s not always as clean-cut as we would like but it certainly gives a starting point for revision. This was produced in Excel and was completed in class with students called up one at a time to RAG rate each sub-topic. What has really worked well with my current KS4 classes is to import this file into Google docs and share the link (editable link) with students who have then completed this as a homework. The spreadsheet looks a little different mostly because it is not possible to have vertical text as the column headings so this causes the spreadsheet to go off the page:
As you can see though we can still identify topics and students requiring more support as before but this can edited again and again by students as they conduct their own revision in the build up to their GCSE exams. Following an after school revision session this week it was very powerful to ask students to re-evaluate the file and many changed some reds to amber, and quite a few to green. There is the potential for one student to go in and delete all or change everyone to red, as many students pointed out, but so far this has not happened as students can see how helpful it is for all concerned. Here is link to a google sheet set up to RAG rate GCSE Science A.
